Introduction

Power BI is a powerful business analytics tool that can help you identify patterns, trends and relationships in the data your business already has in order to discover relevant insights and make informed decisions with them. With its user-friendly interface (if you are familiar with tools such as Word or Excel, it should be fairly simple to get started with it) and advanced features (such as automated data refreshes and custom visualizations with the languages R and Python), Power BI has become increasingly popular in recent years as a way to make data-driven decisions and improve business performance, reducing the chance of negative results from aimless decision making.
Whether you run a small business, are a data analyst, or work for a huge corporation, Power BI may provide a lot of value to your company by bringing to light previously unknown information that is contained in your data.

Here is a list of 10 reasons why you should start using Power BI today:
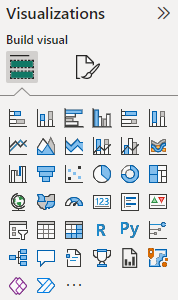
- Data Visualization: Power BI provides an intuitive and easy-to-use interface for creating interactive visualizations, which allow you to get a lot of interesting, varied perspectives on one or more topics. Though the default chart types are many and often suit most people’s needs, there is also a multitude of other ones you may download to give you an even greater set of tools for how you want to present information;
- Scalability: Power BI is highly scalable, allowing it to handle large amounts of data and support enterprise-level business intelligence needs. Whether you have a small dataset or a large, complex data environment, Power BI can accommodate your needs and grow with your business;

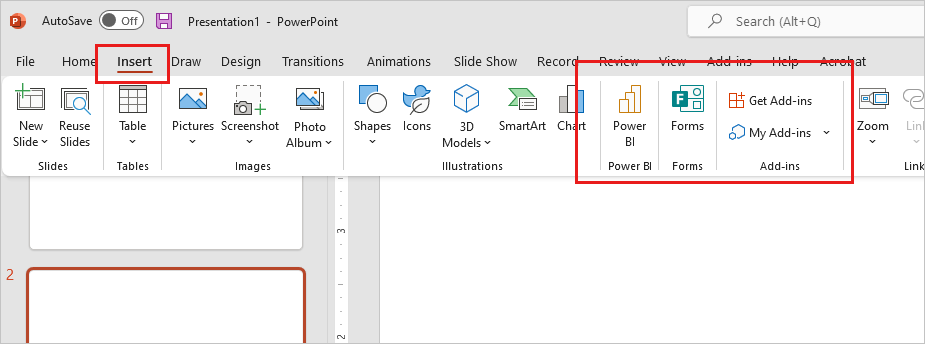
- Collaboration: Power BI makes it simple to share insights and dashboards with your team, enabling everyone to remain in the loop and collaborate more successfully. Besides sharing the file you use on your desktop device (the one with the pbix extension), there are many (often better) ways of doing it, such as using Power BI Service to make them available online for one or more people or using embedding to incorporate it in a certain website;

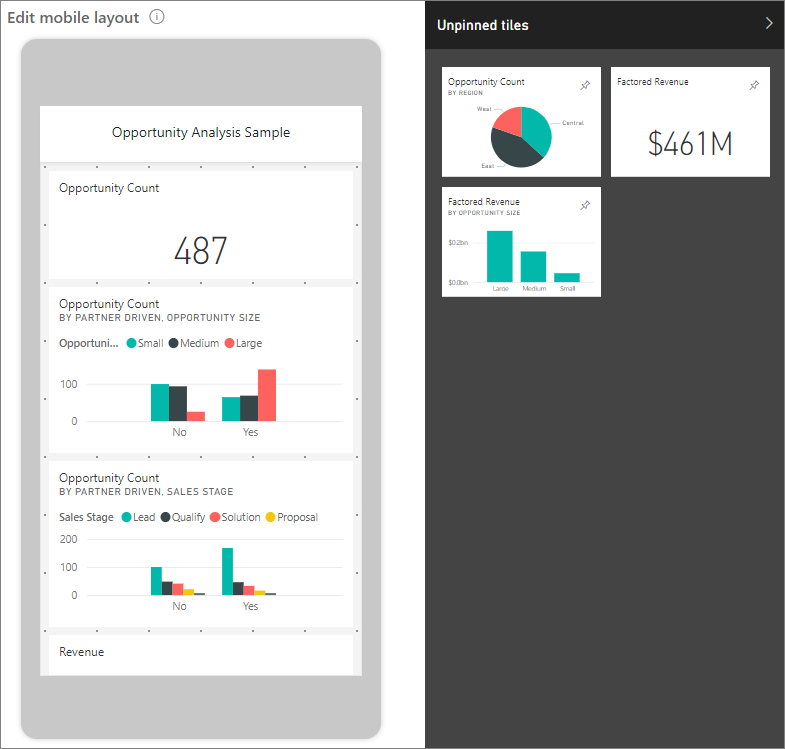
- Mobile Access: You can view your reports and dashboards using the Power BI mobile app from anywhere, getting real-time insights that help you make choices quickly. From the Desktop application, you can freely edit and preview the way it is going to look like in mobile devices at the blink of an eye;
- Real-Time Data: Power BI allows you to connect to real-time data sources (that is, updating your report automatically whenever its sources are updated), providing you with up-to-date insights and allowing you to make informed decisions in real-time;

- Integration with Other Microsoft Tools: Power BI works in perfect harmony with other Microsoft applications, including as Dynamics 365, SharePoint, and Excel.
- Data Security: Power BI’s robust security features ensure that your data is secure, and that only authorized users have access to it;

- Predictive Analytics: Power BI’s advanced analytics features, including machine learning and predictive modelling, allow you to predict future trends and outcomes based on previous history;

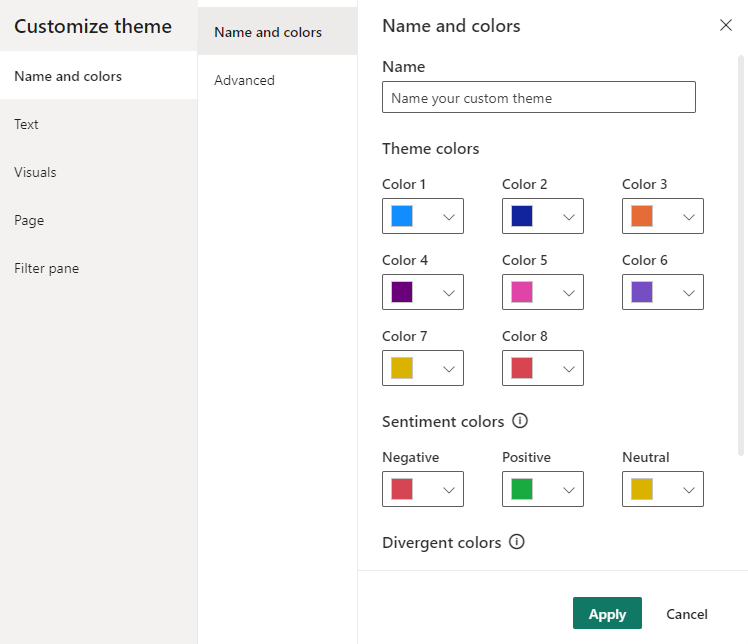
- Easily Customizable Themes: keep your reports consistent with your company’s branding using pre-built or custom themes;
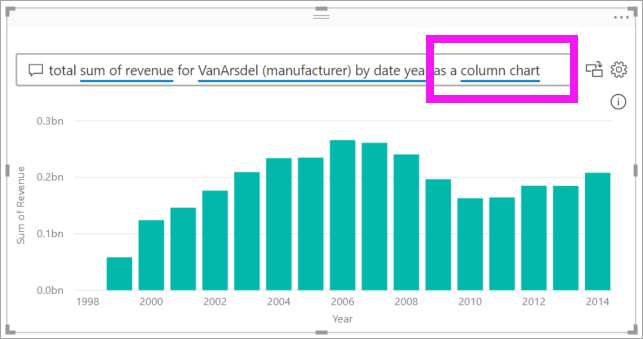
- Q&A feature: one of the interesting features of this software is the usage of natural language queries for asking questions about your data in plain language and receive answers in the form of charts or tables. This feature enables users to quickly explore and gain insights without needing to know SQL or other query languages.
Conclusion
Power BI is an effective (yet user-friendly) tool that may assist you in transforming your data into useful insights, giving you the knowledge you need to stay competitive. With its intuitive interface, advanced features, and robust security, Power BI is a very interesting tool for considering in case your organization is looking for not missing out on the value that lies in the data it has.
Count on nocobi today to help you unlock the full potential of your data with Power BI!

Deixe um comentário