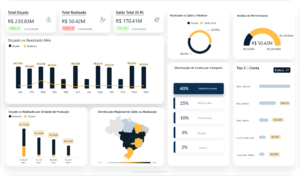
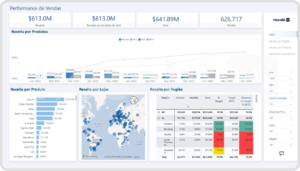
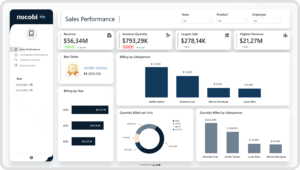
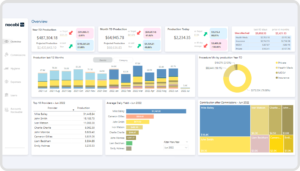
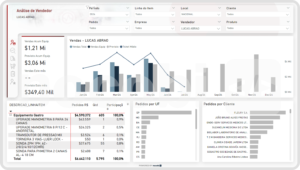
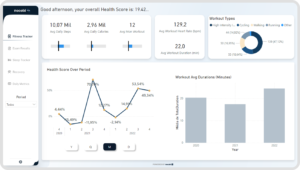
Strategic decisions at your fingertips with Power BI.
Visualize the future of your company
What We Do Best
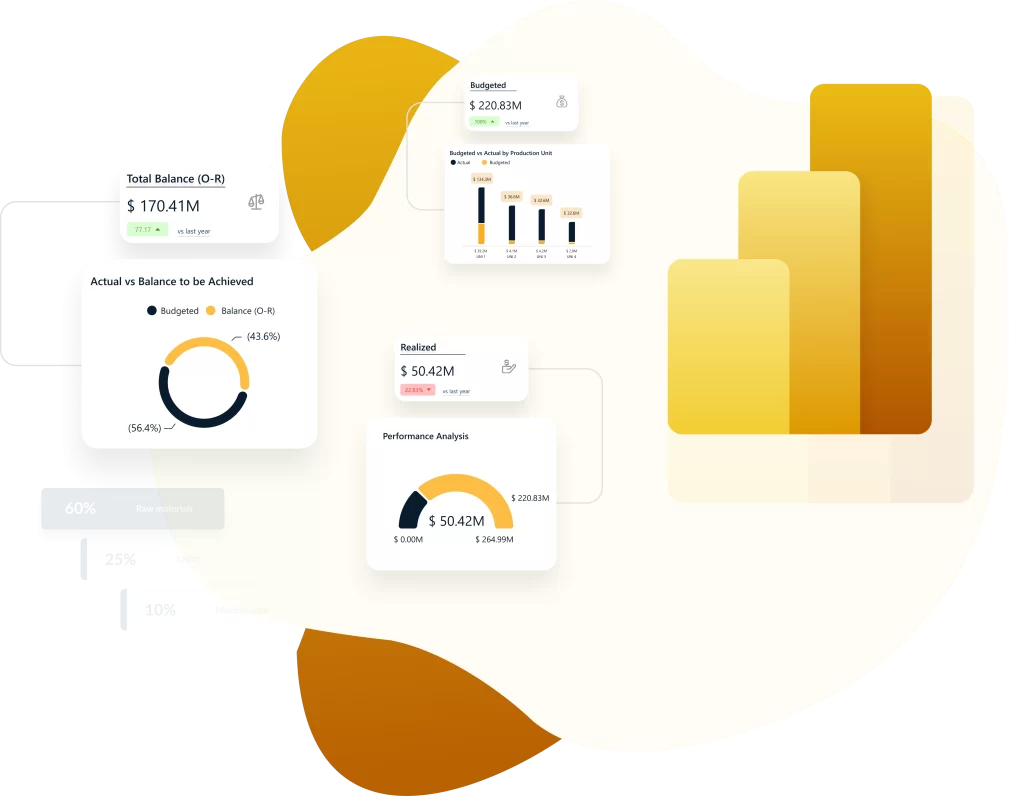
We transform your data into strategic insights that drive your decisions! Creating powerful dashboards is just the beginning. We help you integrate these analyses throughout your company, making your decision-making process more agile, informed, and data-driven from the start.
Custom Business Intelligence Reports
Automation of Manual Processes for Report Creation
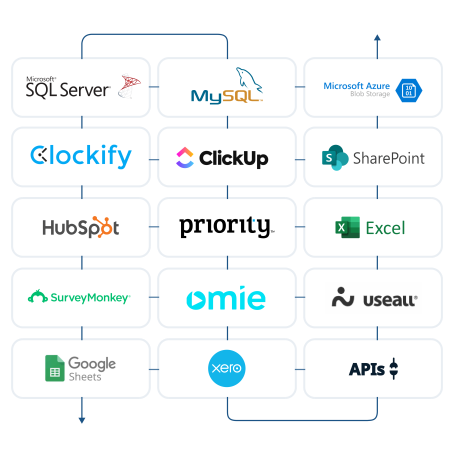
Connection and Integration with Various Systems and Databases
Sales Report
Detailed analysis of sales performance, including trends, period comparisons, and forecasts.
Human Resources Report
Data on recruitment, retention, and employee performance.
Project Report
Tracking of project status, deadlines, and resource allocation.
Risk Analysis Report
Identification and monitoring of financial and operational risks.
Financial Report
Monitoring of cash flow, profits, losses, and the company’s financial statements.
Inventory Report
Stock control, order analysis, and demand forecasting
Customer Analysis Report
Customer segmentation, purchasing behavior, and churn analysi
Customer Support Report
Analysis of customer service, response time, and satisfaction.
Marketing Report
Evaluation of campaign ROI and performance across different marketing channels.
Operational Performance Report
Monitoring of operational efficiency and bottleneck analysis.
Production Report
Evaluation of production, quality, and efficiency of manufacturing processes.
Compliance and Audit Report
Monitoring of compliance with standards and regulations, as well as internal and external audits.
Data sources we already connect
Why have your reports in Power BI ?

Interactive Visualizations
Highly interactive data visualizations that facilitate the analysis and exploration of data intuitively.
Time Savings
Free your team from repetitive tasks, saving valuable time for what really matters.

Secure Database
Build a unique repository with validated data, ensuring the robustness and reliability of your reports.

Management Hub
Centralize all indicators and reports in an easily accessible and manageable cockpit.

Easy Integration
Power BI quickly connects to sources like Excel, SQL Server, and Google Analytics, adapting to your company’s needs.

Continuous Updates
Update your indicators automatically multiple times a day for well-informed and quick decisions.

Error Reduction
Minimize operational errors by automating processes and ensuring accuracy in results.

Advanced Customization
Customize reports and dashboards to meet your company’s needs and preferences.
Transform data into strategic decisions with Power BI ?
Interactive reports that make your decisions faster and smarter.


