There’s a gold mine of insights hiding in your business data and guess what? Microsoft’s Power BI is your very own treasure map. Maybe my metaphor is a little over the top, but trust me when I say Power BI is no less than a magic wand that turns the daunting world of data analytics into a breezy stroll in the park.
So, today, how about we dive headfirst into the pool of knowledge to help you tap into the full potential of your Power BI? Let’s get started!

1. Spring Cleaning isn’t just for your garage
Ever heard the phrase, “What you sow, so shall you reap”? Well, it’s pretty much the same with your data. Messy data is like a rusted, bent-up old treasure chest, and it can mess up your beautiful Power BI reports. So, scrub your data clean! Use consistent naming, kick out duplicates, and keep your data nicely formatted. This sets the foundation for your Power BI adventure.
2. Building your treasure map
Let’s have a chit-chat about data modeling, or in my quirky terms, let’s discuss how to craft your very own treasure map. Stick to the star schema. It’s like having a compass – your facts stay central and dimensions fan out. Plus, Power BI can execute DAX calculations more efficiently this way. Make sure your tables play nicely together with the right relationships and cardinality. This ensures your treasure hunt stays on track.
3. Speaking the DAX language
DAX, short for Data Analysis Expressions, is like the secret code to unlock your treasure chest of data. But you’ve got to be careful! Use your DAX wisely. Overuse can make your reports slower than a pirate with a wooden leg. Favor measures over calculated columns and only use calculated columns when you absolutely need them.
4. Paint a picture worth a thousand data points
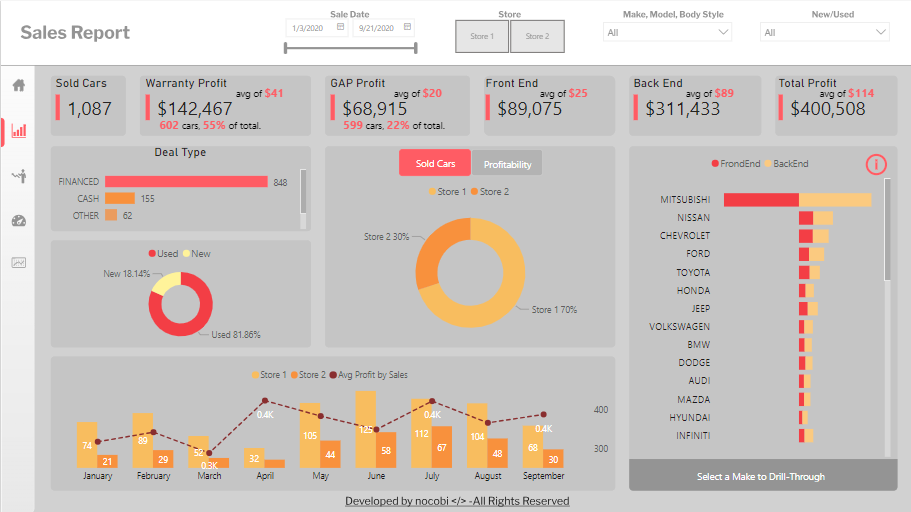
The beauty of Power BI lies in its ability to turn raw data into a visual storytelling masterpiece. But remember, less is more. Avoid cramming in too many visuals, it’s like having too many markers on your treasure map. Keep it sleek, keep it significant, and make sure each visual is a piece of the grand puzzle that you want your story to be.
5. Guard your treasure!
Implementing Row-Level Security (RLS) is like assigning a loyal crew to guard your treasure. It’s a reliable sentinel, making sure the right folks have their eyes on the right piece of data. You don’t want to give away all your secrets, right?
6. Keep your map up to date
Remember to keep your treasure map (i.e., your data) updated. Stale data leads to stale insights. Luckily, Power BI has features that allow for automatic and incremental refreshes. Use them!
7. Power BI’s secret weapon: AI
Did you know Power BI has built-in AI tools like text analytics, key influencer visual, and the decomposition tree? They’re like your hidden cheat codes. Use these to uncover trends and patterns that you might not see otherwise.

Wrapping up, Power BI is your secret weapon to transform dull, hard-to-understand data into exciting, insightful stories. With these best practices and techniques up your sleeve, you’ll be a Power BI champion, ready to unearth those hidden insights and steer your business towards untold success.


Deixe um comentário